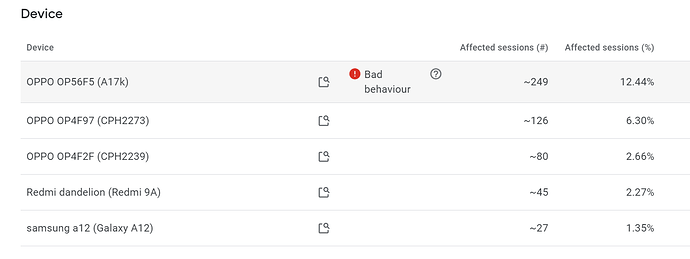
I’ve been battling high ANR (1.5%) for ages… this is a problem devs just can’t solve as this is happening in the core… and this will remain unsolved as there are no resources left to fix issue. even though I paid for vlad to have access to my bugsnag a year ago nothing changes… long story short, he never logged on! money wasted, lesson learnt.
did you know, memory is irrelevant? phone brands decide how much memory is allocated per process? they many limit at 576mb or 1024mb even with 8gb on board. you can google this for more info.
Just googled it, yep. Also Android try to keep backgrounded apps in memory as long as possible, so yeah, memory is irrelevant if user opened many apps. Anyway, it doesn’t explain why so many crashes after API 33 was enabled with the same code.
Interestingly, we have 1 app where crash rate wasn’t affected. It’s online too. The difference is (besides it’s not a card game) in old composer code. We use only create and hide scene there. And on hide we’re forcing to remove scene (not hide it)
On this subject: Do you use any “non-standard” rendering for your images? You posted your build.settings which has plugin.memoryBitmap in it, so I assume you’re not just using newImage/newImageRect with png filepaths for all of your display objects.
I ask because (as we’ve spoken about before) we’ve always had an issue with high ANRs as well, and we’ve also always had non-standard rendering. Initially we were using webp images, which used the webp and bytemap plugins. More recently we changed to use Siu’s binary archive module, which relies on the bytemap plugin.
We had someone at Google take a look at our ANR stack traces, and they seemed to suggest the GL thread was the issue - either loading or garbage collection was holding up the thread.
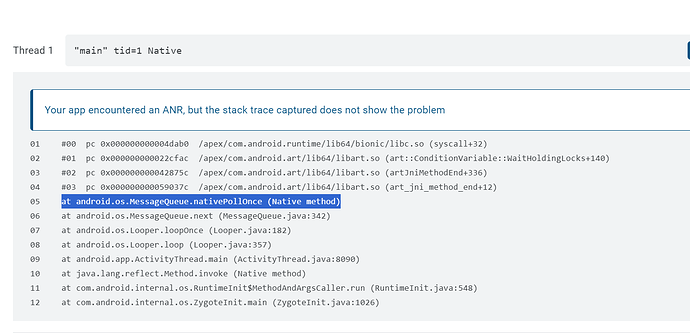
I thought that if we both have non-standard image asset loading/management, that could be to blame. On that note, am I right that remembering that many of your ANRs seem to hit the Controller.stop() function and then end there? I went through the Solar2D source, and there is a step within that function where the Controller directly invokes the GL thread. My theory about what’s happening is:
- The rendering has frozen
- User tries to close the app because it’s frozen.
- App starts to goes through shutdown process, which includes calling the Controller.stop() function.
- The stop function has a line which is attempting to render one more frame - but the GL thread is stuck so it cannot do this. Hence it cannot get beyond the stop function.
I’m running a test at the moment which staggers the releaseSelf function of textures which need to be unloaded, to see if reducing the burden on the GL thread helps.
I load pngs into newTexture and then lazy load into newImageRect on demand. I use newTexture for almost all asset management and have to have onResume() events to reload them as Solar doesn’t bother.
I have a specific use case for bytemap - drawing a minimap were each pixel represents a tile in the game. It is so much faster drawing pixels than images.
In console they mainly show as controller.stop() - main thread locked. Bugsnag highlighted the problem was related to memory after a suspend/resume had occurred mainly. Before suspend there are problems. After resume, hundreds of memory trims and low memory warnings.
I suspect all the memory thrashing is what eventually causes the ANR, even though the trigger event (the suspend/resume) may have happened some time ago.
If it helps, I do not use composer. I use my own scene manager and never keep scenes hidden. They are all dynamic anyway so hiding them (and using up memory) doesn’t really make sense.
I see. I’m thinking of trying to remove scene rather than hide it. Maybe it help with trim memory crashes.
We are also encounter the ANR cause by controller.stop(), the problem seems to be related to competition for lock resources during the life cycle.
Could you provide demo to reproduce it? For help me find a solution to fix it. Thanks.
If you also have the same then you have all the code required surely?
A unit test would be many hundreds of images, textures, audio, timers and enterframes. Then use a crappy android device to test lifecycle events on. ARM Cortex-A53 is by far the worst so start there.
And what is with this device?
Thanks for the tip.
I’m looking for minimum demo bcoz I can’t reproduce in online case, even if endless while loop. 
First one same as mine.
And second may related to apk/obb/aab size and slow storage.
This is quite logical as I have almost 8k assets in my app (although not all will be used). I’ve had to block devices 2GB and under. If only Solar could acknowledge the user input but ignore it (return true or whatever) during life cycle events?! That would fix this problem.
I am trying to understand those mechanism which handles resources.
However, Solar2D Android app runtime memory MAYBE can reduced a apk/assets/resource.car's actual size, it is experimental.
So If I have experimental build in future, no promises, could you test the build in advance?
Happy to test sure.
Surely this fixes all future problems too?
It is difficult to say. Currently, controller.stop() ANR cannot be reliably reproduced.
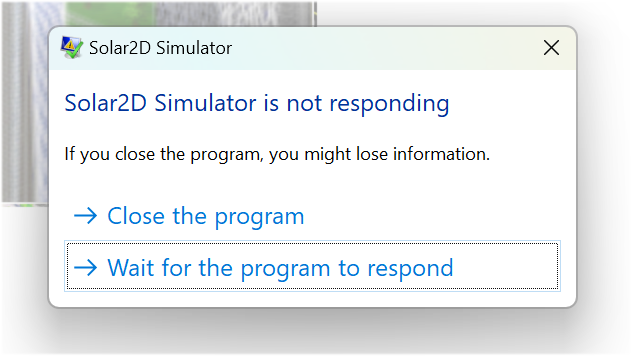
even sim is not immune to ANRs. this often happens on resizing the window.

I have new results.
-
I have compiled with build 3699 another of my app that does not use IAP plugin (“plugin.google.iap.billing.v2”.), And that until now I had not compiled for API 33, and the crash rate shot out of 0.47% to 5.0%
-
In one of the apps that had been trying with several changes for a long time, the last change I made was to completely eliminate the IAPS plugin, and the crash rate, although it lowered a little, it remains very high (3.73 %)
With these two results, although the integrated purchasing plugin can have any impact, it would not be the main problem apparently.
Of all the apps that I have compiled for API 33 (with Build 3692+), around 10 apps, doing different tests, only 2 have not increased the crash rate, and have remained below the threshold of bad behavior. The only relevant characteristic that I had found in these two apps was that they did not use integrated purchases, but as mentioned with the previous result would rule out that a poor implementation of this plugin could be the problem, added to other developers have mentioned that they use integrated purchases and They have not had problems.
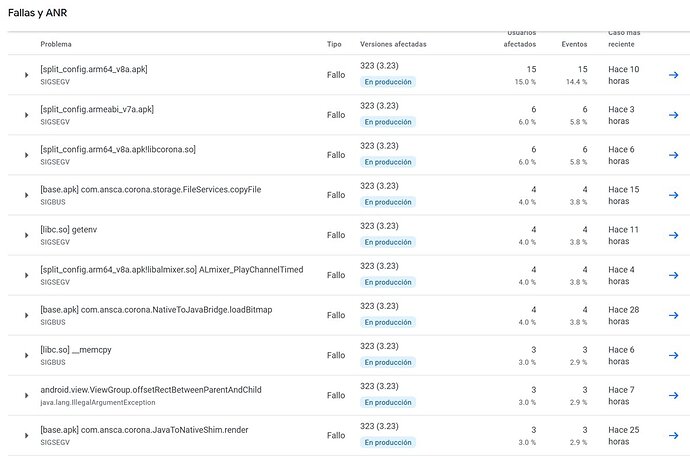
Within the most relevant apps and that have considerably increased the crash rate with 3692+, currently the most significant failures are:
Following this very closely and hoping these core issues can be fixed.
It’s always frustrating when it’s out of our control. I’ve tried to narrow down the cause as well, to help figure out a solution. But like all of you, I can’t seem to figure it out.
Still having those openal crashes too that mention onComplete event though I don’t even use it.


