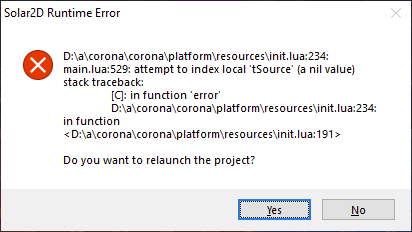
This should fix stack traces while also keeping the new profiling features intac…t.
---
As with Lua code, where you do a couple of `system.getTimer()` or `os.clock()` calls and take the difference, the profiling logic must start and end somewhere. These are more complex than simple numbers, so an error in the middle could leave things in a broken state.
This would blow up for a couple reasons. Listeners were getting profiled, and this would include "unhandledError", which would interact with the aforementioned brokenness. Alternatively, you might have an error in a `pcall()`'d routine and run into a similar situation down the line.
I was trying to address this by `pcall()`ing the listeners' functions and, if necessary, cleaning up the state and relaying the error.
By handling errors that way, however, I was throwing away info that would propagate to the ultimate handler and give us a trace.
---
Also, `pcall()` is, by its nature, not as fast as a raw call, so some slowdown was introduced, albeit probably minor for most needs.
---
In the absence of errors, everything is handled by the `_beginProfile()` and `_endProfile()` calls. The problem is that, without something like our earlier `pcall()`s, errors will miss the `_endProfile()` calls on the way back.
There could be a failsafe in the unhandled error logic, but it would miss the cases where users themselves call `pcall()`, or errors in coroutines that are left on their stack rather than being thrown.
You could be inside a listener that was called by another listener (and so on), e.g. via a `dispatchEvent()` inside the "enterFrame", in the simplest case. A user might do a `pcall()` inside one of these listeners but have an error deeper in the chain: this should only unravel the state up to the point of said `pcall()`.
Together with coroutines, these suggest we actually need to operate at the level of Lua's call stack.
What I ended up doing was adding a feature to "bookmark" the stack frames where some kind of deterministic state opens, in this case when a listener began, and that is closed when it ends. These are per-thread, so any coroutines will each have their own distinct sets.
Rather than penalize the average Lua call, these are added and removed—in the absence of an error—manually in `_beginProfile()` and `_endProfile()`.
If a `pcall()` traps an error, these bookmarked frames will be peeled off and a handler will close any profiling states attached to them. Any frames below the `pcall()` site are left intact.
Coroutines are a little different due to how they leave the error information on their stack. In the case of an error or yield, all the bookmarked frames will be put to sleep (profiling states closed, but bookmarks left intact). A resume, on the other hand, will wake them back up (opening states).
The bookmark info consists of an index (where the frame is in its call stack) and a listener ID. These are each 16-bit integers that are bitwise or'd together. (This is only for compactness and are implementation details, so could be changed if it ever becomes limiting.)
---
Generating these IDs meant a redesign of the profiling logic, from a previous linked list of profiles to an array.
(This would probably have been a good idea anyhow, as with any sufficient number of profiles the search through the list would have gotten quite slow and wasn't cache-friendly besides.)
The C++-side listeners now each cache an ID on first use. On the simulator this means incrementing a comparison value at the beginning of each run to invalidate those IDs. On the Lua side, the ID is created on demand along with a table or function listener array.
---
Those profile arrays want `Rtt_Allocator`s, so this called for some rearrangement for initialize and destroy logic. On Windows this worked fairly well, but I got a nasty surprise when testing on Mac. 😄 Basically, during relaunches there's a `Finalizer()` that gets called first followed by the new `Initialize()`... on Windows. On Mac it seems to do the latter then finalize, so using that to clean up some state in `static` variables was a problem. I ended up putting the offending bits into a new `ProfilingState` singleton that belongs to the `Display` and participates in its lifetime.
I moved a _lot_ of stuff around and into that state. I left the sums alone (since they're fine as a linked list), as well as a couple methods, although they might be a strange fit now. Anyhow, fewer globals, so should be cleaner all told.
---
Attached are my tests:
[profile_fix_tests.zip](https://github.com/coronalabs/corona/files/13258638/profile_fix_tests.zip)
I've commented out the actual profiling printouts and table listeners, just because it got really noisy, but they can be added back.
There's file output if you run it through the shell, which I did just to make sure it worked without the simulator-side invalidation of IDs.
Anyhow, if `Rtt_Debug` is defined a few helper routines seen in these tests are enabled, but not otherwise.
I tried to test a range of normal behavior, in both regular calls and coroutines, throwing errors or not, and can explain if there's any interest. The output can be a little weird since the call stack + profiling state won't actually be removed until you exit the current function, but knowing that it's possible to compare for correctness.
Unhandled errors (with a listener or otherwise) are actually called by Solar within a larger enclosing `pcall()`, so you will still see the aforementioned details there as well.
---
In theory the bookmark stuff could be used as a poor man's version of Lua 5.4's to-be-closed variables, pegged to listeners (the profiling states are basically one such resource). At the moment they're still pegged to a couple of profiling quirks, though.
---
Open issue( ? ): I don't know if debug hooks need any handling with respect to bookmarks.


